COLOR-INFRARED: AERIAL MAPPING & GIS
More Than Meets the Eye:
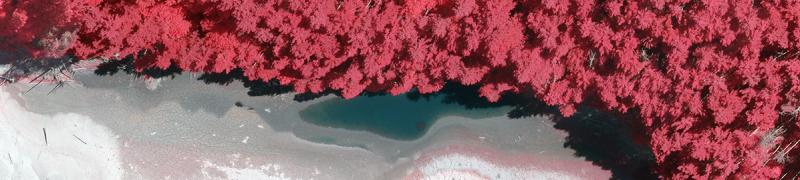
More than meets the eye...or, at least, more than our eyes are geared to see. Color-Infrared (CIR) content, using the Near-Infrared (NIR) range, sits a tick outside of what we consider 'Natural Color' within the light spectrum - technically between the range of 0.70 to 1.0 micrometers. Color-Infrared mapping typically substitutes the 'Natural Color' of Red for the Near-Infrared spectrum in order to visualize this otherwise 'invisible' color range, making its 'presence' visible to the human eye. This is also why 'Color-Infrared' mapping is also known a 'False Color' mapping, because the 'Natural Color' Red is simply assigned as the Near-Infrared spectrum, visually 'filling-in' for its signature and intensity, which would otherwise not be visible as a 'Natural Color'. Color-Infrared is also known as 4-Band (RGB+NIR).
Let's Reflect For A Moment
Nevertheless, this spectrum range carries with it some interesting information. In regard to vegetation, healthy plant actively reflects Near Infrared energy very efficiently to avoid overheating. Inversely, stressed (or dead) vegetation does not have the ability to defend itself as well and absorbs more Near-Infrared energy. In this way, the vibrancy of the assigned Red value indicates the intensity of active chlorophyll that, in turn, can be an indicator of vegetation health. At an even more detailed analytical level, individual plant species can be identified through subtle differences in their spectral signatures making it possible to document vegetation and crop types using Color-Infrared aerial mapping. Inversely, surfaces that completely lack photosynthetic activity will typically absorb the Near-Infrared spectrum and the assigned color Red value will not appear. Different tones of blues, greens, and tans can reflect other landscape characteristics including soil types, moisture, water depth and sedimentation.
Putting Color-Infrared Mapping & GIS to Work
All this being said, taking Color-Infrared Aerial and Satellite Mapping (Learn More) and even UAS Mapping (Learn More) and integrating it into GIS solutions can be a very useful geospatial resource, especially in concert with 'Natural Color' (RGB) aerial mapping and even LiDAR data for cross-reference. Color-Infrared aerial mapping is, obviously, a useful tool for vegetation health and type analysis, offering diverse application opportunities within Smart City Programs, agriculture, forestry, planning, sports facility operations, environmental assessment and watershed management. Color-Infrared aerial mapping is also very scalable from assessing a national forest or irrigation district to documenting the condition of individual tree saplings or plantings along a farm row. Inversely, taking a different tack, Color-Infrared is also useful at identifying surfaces that do not contain organic elements such as asphalt and concrete. These features are also known as 'impervious surfaces'. Color-infrared offers an concise visualization for identifying and documenting these surface types through planimetric mapping for use various watershed and drainage modeling applications in a GIS environment. Color-infrared can also lend perspective on mapping various soil and rock types, soil moisture levels, and even water depth and sediment character which can all be integrated into a GIS solution for environmental monitoring.
NDVI (Normalized Difference Vegetation Index)?
Although the acronym NDVI (or Normalized Difference Vegetation Index) seems to surface frequently in association with Color-Infrared vegetation assessment, especially in regard to localized aerial mapping projects, it is not necessary the most straightforward (or appropriately utilized) method. Like anything to do with energy and standardized signature interpretation (also see thermal mapping), things get tricky. NDVI was a concept generated specifically for satellite recon of biomass during the 1970's. Basically, consistent Near-Infrared interpretation was challenging due to varying solar zenith angles around the planet. So, a system was developed to 'normalize' changing solar zenith angle, thereby 'attempting' to standardize interpretation. But, as mentioned before, energy (including NIR) is tricky and easily distracted, creating many opportunities for interfering inputs and complex signatures often befuddling structured interpretation. This being said, the utility of NDVI can be questionable in association with aerial mapping projects if not approached with the appropriate processing and intrepretative practices. For this reason, our team consists of seasoned experts in the field of infrared imaging.
Let Us Know How We Can Help:
Our North American digital aerial flight teams and access to current satellite imagery for regional and international projects makes Access Geographic a leading provider of effective Color-Infrared mapping and GIS solutions - let us know how we can help your geospatial project move forward.